Why Do You Need a Conductivity Meter?
Why Do You Need a Conductivity Meter? The answer begins with a simple fact: water can look clean and still contain dissolved salts, acids, or other conductive substances. A Conductivity Meter measures how readily a solution carries electrical current. Its reading gives technicians a quick, useful indicator of dissolved ionic content. It does not identify each substance. That limitation matters.
In a laboratory, a technician may rinse the probe, check the calibration solution, and watch the reading settle on the display. In a greenhouse, the same tool can help monitor nutrient solutions before delicate plants show stress. Water-treatment teams use conductivity readings to spot changes that deserve investigation. Small details affect results. Temperature, contamination on the probe, and poor calibration can all shift a measurement.
An expert quotation should be verified before publication rather than invented. Insert a sourced statement here from a named conductivity-meter specialist: “[Verified quotation about accurate conductivity measurement].” That check supports trust and gives readers a clear expert perspective. A meter is not a complete water analysis, and one reading should not be treated as a verdict. It is a practical signal—valuable when interpreted carefully, but easy to overread. That is worth remembering.
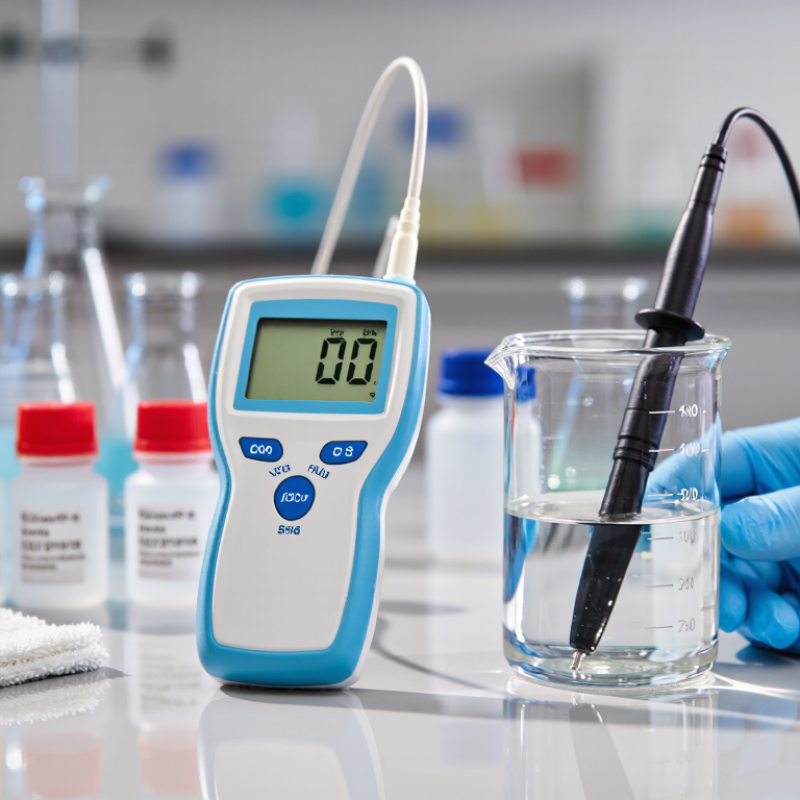
What Electrical Conductivity Measures: Ions, Cell Constants, and µS/cm
Why Do You Need a Conductivity Meter?
What Electrical Conductivity Measures: Ions, Cell Constants, and µS/cm
A conductivity meter measures how readily a liquid carries electrical current. In water, dissolved ions—such as those from salts and minerals—allow that current to flow. More ions often mean higher conductivity, but the reading does not identify which ions are present. That distinction matters. A clear glass of water can still contain plenty of dissolved material.
The probe’s cell constant accounts for the spacing and area of its electrodes. It helps the meter translate the electrical response into conductivity, commonly shown in microsiemens per centimeter (µS/cm). A suitable cell constant depends on the expected range, so check the instrument’s specifications. Temperature also affects readings; automatic compensation helps, but it may not match every sample or measurement standard. Small details count.
Tips: Rinse the probe with clean water between samples, then gently blot it. Avoid wiping the sensing surface, which can affect the reading. Wait for the display to stabilize, and record the sample temperature. Calibrate with an appropriate standard when accuracy matters.
Use conductivity as a quick indicator, not a complete water analysis. A meter cannot tell you exactly what is dissolved, and I sometimes need a separate test to answer that question. If readings vary, check for residue, bubbles around the probe, or temperature changes before drawing conclusions.
How Conductivity Meters Convert Electrical Signals into Temperature-Adjusted Readings
Why Do You Need a Conductivity Meter?
How Conductivity Meters Convert Electrical Signals into Temperature-Adjusted Readings
A conductivity meter estimates how readily a liquid carries electric current. Place its probe in a sample, and electrodes apply a small alternating signal. The meter measures the resulting conductance, then uses the probe’s cell constant to calculate conductivity. This helps compare water samples, check rinse quality, or monitor a process. A reading is useful, but it does not identify which dissolved substances are present.
Temperature matters. A warmer sample usually conducts electricity more readily, even when its dissolved-ion content has not changed. The meter measures the sample temperature and applies a compensation factor to report conductivity at a chosen reference temperature, commonly 25°C. Automatic compensation is convenient, but it relies on a temperature coefficient. That coefficient varies with the solution. There is a catch. A default setting may make a precise-looking reading misleading, especially for unusual mixtures. Check the instrument’s settings and use a coefficient suited to the sample when accuracy matters.
Tips: Calibrate with a suitable conductivity standard, rinse the probe with clean water, and gently blot away droplets. Keep the sensing area fully immersed, without trapping air bubbles. Let the reading stabilize before recording it. Small handling differences can shift results; I would note sample temperature and settings alongside each measurement.
Why Water Quality Monitoring Matters: USP <645> Sets a 1.3 µS/cm Limit at 25°C
Why Do You Need a Conductivity Meter?
Why Water Quality Monitoring Matters: USP <645> Sets a 1.3 µS/cm Limit at 25°C
Water may look clear and still contain dissolved ions. A conductivity meter detects their combined effect by measuring how readily water carries an electrical current. Under USP <645>, the Stage 1 limit at 25°C is 1.3 µS/cm for applicable compendial water. It is a specific checkpoint, not a universal limit for every water use. Small changes matter. Temperature also affects conductivity, so readings must be assessed using the method’s temperature requirements. A meter helps operators spot shifts early, before they become persistent process issues. It does not identify individual contaminants or prove water quality on its own.
Tips: Check the probe for residue, use a suitable calibration standard, and allow the reading to stabilize. Record the temperature with the result. If a Stage 1 reading exceeds the applicable limit, follow the next steps in USP <645>; do not rely on a single number without checking the procedure and measurement conditions.
A conductivity trend can reveal a gradual change, such as a rise after maintenance or a drop in system performance. Yet even careful measurements have limits: a clean probe, sound calibration, and consistent sampling technique all matter. The number is useful, but it is not the whole story.
Why Do You Need a Conductivity Meter? - Why Water Quality Monitoring Matters: USP <645> Sets a 1.3 µS/cm Limit at 25°C | Monitoring dimension | What the conductivity meter helps assess | Reference or interpretation |
| USP <645> Stage 1 benchmark | Measures the electrical conductivity of water, an indicator of dissolved ionic substances. | At 25°C, the Stage 1 limit is 1.3 µS/cm. The applicable limit depends on the sample temperature; use the USP table and procedure for the measured temperature. |
| Temperature | Records sample temperature alongside conductivity, which changes with temperature. | For USP <645> Stage 1, compare the measured conductivity and temperature with the applicable table value; do not assume a 25°C limit applies at every temperature. |
| Illustrative reading: 0.8 µS/cm at 25°C | Shows a sample reading below the 25°C Stage 1 limit. | Below 1.3 µS/cm; this comparison alone is not a substitute for following the complete USP test procedure. |
| Illustrative reading: 1.3 µS/cm at 25°C | Shows a sample reading at the stated Stage 1 limit. | At the 25°C limit. Apply the compendial method, including its measurement and reporting requirements. |
| Illustrative reading: 1.6 µS/cm at 25°C | Flags a result above the 25°C Stage 1 limit for follow-up. | Exceeding the Stage 1 value means the subsequent steps in USP <645> should be followed; it does not, by itself, establish the final disposition. |
| System trend monitoring | Helps identify changes over time that may warrant investigation, such as shifts after maintenance or changes in operating conditions. | Evaluate trends against established site procedures and specifications; conductivity alone does not identify the specific contaminant. |
| Measurement quality | Supports consistent results when the instrument is suitable for low-conductivity water and is maintained and calibrated as required. | Use clean sampling practices, appropriate cell handling, and the applicable test method to reduce measurement errors. |
Note: The example readings are illustrative, not actual test results. Refer to the current USP <645> procedure and applicable requirements for official testing and decisions.
Where Meters Are Used: From 0.055 µS/cm Ultrapure Water to Seawater
A conductivity meter can track water from nearly ion-free laboratory supply to mineral-rich seawater. At 25°C, ideal ultrapure water is about 0.055 µS/cm; even brief contact with air can raise its reading as carbon dioxide dissolves. The USGS Water Science School reports seawater conductivity near 50,000 µS/cm, though temperature and salinity affect the result. That is a range of nearly a million-fold. Small errors matter.
In laboratories, semiconductor processes, and pharmaceutical water systems, low readings can flag ionic contamination. In rivers, aquaculture, and seawater monitoring, higher readings help reveal changes in dissolved salts. The UNESCO/IOC Practical Salinity Scale 1978 links seawater conductivity with salinity, making stable temperature control essential. A meter does not identify which ions are present. That limitation is easy to overlook.
Tips: Match the probe’s range to the sample, rinse it between measurements, and use temperature compensation. Calibrate with a suitable standard near the expected reading. For ultrapure water, measure quickly in a clean, covered vessel; waiting can change the result. Check the probe condition, too. Sources: USGS Water Science School, “Conductivity (Electrical Conductance) and Water”; UNESCO/IOC, Practical Salinity Scale 1978.
How to Select and Verify a Meter: Range, Accuracy, Calibration, and Temperature Compensation
A conductivity meter is useful only when its range matches the sample. A low-conductivity rinse water and a concentrated process solution need different measurement ranges. Check the meter’s stated range and resolution before buying. A reading near the edge of that range may be less dependable. Leave room for samples that vary during production.
Accuracy matters, but read the specification carefully. It may be stated as a percentage of the reading, a fixed value, or both. Compare that tolerance with the limits your work requires. Verify the meter using a fresh conductivity standard close to your expected sample value. Rinse the probe with clean water, blot gently, and avoid touching the sensing surface. Check again after calibration. A drifting reading deserves investigation, not a quick adjustment. Small details matter.
Temperature can change conductivity noticeably. Automatic temperature compensation helps report values at a reference temperature, often 25°C, but it does not make every sample behave identically. Confirm the compensation setting and temperature sensor are appropriate for your solution. For a useful check, measure a stable standard at a known temperature and compare the result with its reference value. Calibration can feel routine; skipping it is an easy mistake to regret.